Instrumentation Diagrams ~ Learning Instrumentation And Control Engineering Learning Instrumentation And Control Engineering

Basics of Instrument Loop Diagrams

Custom Search

Instrument loop diagrams are also called instrument loop drawings or loop sheets. These set of drawings are more detailed than process and instrument diagrams (P&IDs). Loop diagrams are the most detailed form of diagrams for a control system and thus it must contain all details omitted by PFDs and P&IDs alike. Loop drawings can be customized per customer taste although certain minimum standard information is required to be included in loop sheets. However, the more detail you put into a loop diagram, the easier it makes the inevitable job of maintaining that system at some later date.
Typical information you would see on an instrument loop diagram or sheet are:

  1. They show all the instruments in a control loop
  2. Each instrument bubble in a loop diagram represent an individual device with its own terminals for connecting wires.
  3. Dashed lines in instrument drawings represent individual copper wires rather than whole cables
  4. Terminal blocks where wires connect are represented by squares with numbers in them.
  5. Cable numbers, wire colours, junction block numbers, panel identification, and grounding points are all shown in loop diagrams.
  6. Every instrument in a loop drawing has an input calibration and an output calibration specified for the instrument. For example in our loop drawing below, PDT (Pressure Differential Transmitter)-42 has an input calibration of 0 -200 PSID and gives out a 4 – 20mA as output. This 4 – 20mA is the output calibration.
  7. Loop drawings specifies the action of an instrument. That is whether the instrument is reverse- acting or direct-acting. An arrow pointing up or down close to the instrument is used to denote   either of direct-acting or reverse-acting. An up arrow represents a direct-acting instrument- one whose output signal increases as the input stimulus increases. A down arrow close to the instrument represents a reverse-acting instrument- one whose output signal decreases as the input stimulus increases.
Shown below is a typical instrument loop or sheet diagram. We have used red arrows to show some common features. Study the drawing and see how many much more detail you could have on an instrument loop drawing:
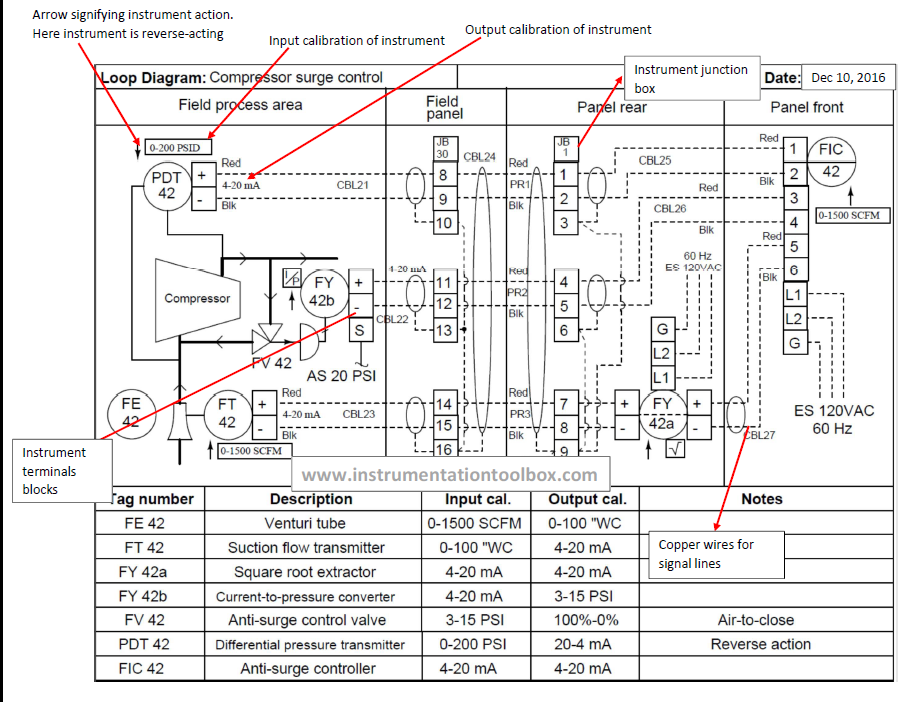
Typical Instrument Loop Drawing 


Instrument Abbreviations Used in Instrumentation Diagrams (P&IDs) III

Custom Search

To further understand instrument abbreviations used in instrumentation and process diagrams, we have presented more examples of the common combinations of instrument abbreviations you may likely come across. They include abbreviations for switches and alarm devices, transmitters, solenoids, relays, computing devices, primary elements, test points, well or probe, viewing devices e.g glass, safety devices as well as final elements. 

The main objective of bringing many possible combinations of these process instruments is to drive home the understanding of how they are formed such that once you see them being used in a process or instrumentation diagram or even conceptual or flow diagrams, you will immediately be in a position to identify them and know what they are being used for.

First Letters
Initiating,  Measured, Variable
Switches & Alarm Devices*
Transmitters
Solenoids,
Relays,
Computing
Devices
Primary
Element
Test Point
Well or Probe
Viewing
Device,
Glass
Safety
Device
Final
Element
High**
Low
Comb
Recording
Indicating
Blind
A Analysis ASH ASL ASHL ART AIT AT AY AE AP AW

AV
B Burner/
Combustion
BSH BSL BSHL BRT BIT BT BY BE
BW BG
BZ
C User's Choice


D User's Choice


E Voltage ESH ESL ESHL ERT EIT ET EY EE


EZ
F Flow Rate FSH FSL FSHL FRT FIT FT FY FE FP
FG
FV
FQ Flow Quantity FQSH FQSL

FQIT FQT FQY FQE


FQV
FF Flow Ratio FFSH FFSL


FE


G User's Choice


H Hand

HS


HV
I Current ISH ISL ISHL IRT IIT IT IY IE


IZ
J Power JSH JSL JSHL JRT JIT JT JY JE


JV
K Time KSH KSL Cell KSHL KIT KT KY KE


KV
L Level LSH LSL LSHL LRT LIT LT LY LE
LWLG
LV
M User's Choice


N User's Choice


O User's Choice


P Pressure/
Vaccum
PSH PSL PSHL PRT PIT PT PY PE PP

PSV, PSEPV
PD Pressure,
Differential
PDSH PDSL
PDRT PDIT PDT PDY PE PP


PDV
Q Quantity QSH QSL QSHL QRT QIT QT
QE


QZ
R Radiation RSH RSL RSHL RRT RIT RT RY RE
RW

RZ
S Speed/
Frequency
SSH SSL SSHL SRT SIT ST SY SE


SV
T Temperature TSH TSL TSHL TRT TIT TT TY TE TP TW
TSE TV
TD Temperature,
Differential
TDSH TDSL
TDRT TDIT TDT TDY TE TP TW

TDV
U Multivaraible


UY


UV
V Vibration/
Machinery
Analysis
VSH VSL VSHL VRT VIT VT VY VE


VZ
W Weight/
Force
WSH WSL WSHL WRT WIT WT WY WE


WZ
WD Weight/
Force,
Differential
WDSH WDSL
WDRT WDIT WDT WDY WE


WDZ
X Unclassified


Y Event/State/
Presence
YSH YSL


YY YE


YZ
Z Position/
Dimension
ZSH ZSL ZSHL ZRT ZIT ZT ZY ZE


ZV
ZD Gauging/
Deviation
ZDSH ZDSL
ZDRT ZDIT ZDT ZDY ZDE


ZDV

*A, Alarm, the annuciating device, may be used in the same way as S, switch, the switching device.
** The letters H and L may be omitted in the undefined case.
The table above is a guide. It does not cover all possible combinations of  instrument abbreviations that one may encounter in the process industry.

Note that apart from the combinations above, there are some other possible combinations when it comes to instrument abbreviations. Some combinations which might not be common in your process plant are shown in the table below:

Instrument Abbreviation
Meaning or Designation Used to Qualify Instrument
FO
Restriction Orifice
FRK, HIK
Control Stations
FX
Accessories
TJR
Scanning Recorder
LLH
Pilot Light
PFR
Ratio
KQI
Running Time Indicator
QQI
Indicating Counter
WKIC
Rate-of-Weight-Loss Controller
HMS
Hand Momentary Switch


Instrument Abbreviations Used in Instrumentation Diagrams (P&IDs) II

Custom Search

We have already seen how the letters A – Z are combined in instrumentation diagrams to give process instruments unique function and identification in Instrument Abbreviations Used in Instrumentation Diagrams (P&IDs). Since the subject of process instrumentation diagrams is versatile and at the heart of understanding key industrial processes, we present further examples of instrument abbreviations as defined in the ISA 5.1 standard for symbols used in P&IDs. In the table presented below, we have:
(a) A column for the first letter denoting the process variable
(b) A second column denoting the initiating or measured variable
(c) A third column for controllers of various degrees – recording, indicating, blind (denotes a controller without a modifying function such as recording or indicating) and self-actuated control valves designed to regulate diverse process variables
(d) A fourth column for readout devices which can either be recording or indicating as the case maybe.

The table for instrument abbreviations shows many possible combinations for any kind of instrument measuring the defined variables as denoted by the first letter in the first column.

First Letter
Initiating or Measured Variable
Controllers
Read out Devices
Recording
Indicating
Blind
Self-Acutated Control Valves
Recording
Indicating
A Analysis ARC AIC AC
AR AI
B Burner/Combustion BRC BIC BC
BR BI
C User's Choice


D User's Choice


E Voltage ERC EIC EC
ER EI
F Flow Rate FRC FIC FC FCV, FICV FR FI
FQ Flow Quantity FQRC FQIC

FQR FQI
FF Flow Ratio FFRC FFIC FFC
FFR FFI
G User's Choice


H Hand
HIC HC


I CurrentIRC IIC

IR II
J Power JRC JIC

JR JI
K Time KRC KIC KC KCV KR KI
L Level LRC LIC LC LCV LR LI
M User's Choice


N User's Choice


O User's Choice


P Pressure/Vacuum PRC PIC PC PCV PR PI
PD Pressure, Differential PDRC PDIC PDC PDCV PDR PDI
Q Quantity QRC QIC

QR QI
R Radiation RRC RIC RC
RR RI
S Speed/Frequency SRC SIC SC SCV SR SI
T Temperature TRC TIC TC TCV TR TI
TD Temperature, Differential TDRC TDIC TDC TDCV TDR TDI
U Multivariable


V Vibration/Machinery Analysis


W Weight/Force WRC WIC WC WCV WR WI
WD Weight/Force, Differential WDRC WDIC WDC WDCV WDR WDI
X Unclassified Cell Cell Cell Cell Cell Cell
Y Event/State/Presence
YIC YC
YR YI
Z Position/Dimension ZRC ZIC ZC ZCV ZR ZI
ZD Gauging/Deviation ZDRC ZDIC ZDC ZDCV ZDR ZDI


Piping and Instrumentation Diagrams Tutorials V

Custom Search

Studying a variety of P&IDs is the best way to learn how to read one of them. Although the symbols used in these diagrams are the same, the way they are used in piping and instrumentation diagrams differ. Below here is one more P&ID for you to study. This P&ID is adapted from a real plant instrument diagram to help learn the basics of how to read such diagrams:

Symbols Used in the P&ID

The first thing to do with any P&ID is to try to identify the various instrument symbols used. This can usually be


Piping and Instrumentation Diagrams Tutorials IV

Custom Search

Piping and Instrumentation Diagrams have been extensively dealt with on this website. However, the best way to be proficient in reading P&IDs is to study a wide array of piping and instrumentation diagrams.
Therefore in this tutorial, I will simply tabulate the instrument abbreviations used in the P&ID below and the symbols used in the diagram:

 Symbols Used in the P&ID

The first thing to do with this P&ID is to identify the various instrument symbols used. To help in understanding this P&ID, the various symbols used


Common Terms Used to Interprete P&ID Drawings

Custom Search


Interpreting P&IDs can often be very challenging especially for beginners. In this piece, I shall be elaborating on some commonly misunderstood terms used in P&IDs to enable the beginner better understand how to interpret the P&ID drawings of their respective plants.


Computing Device
This is a device or function that performs one or more calculations or logic operations, or both, and transmits one or more resultant output signals. A computing device is sometimes called a computing relay.

Converter
A device that receives information in one form of an instrument signal and transmits an output signal in another form is called a converter. An instrument which changes a sensor's output to a standard signal is properly designated as a transmitter, not a converter. Typically, a flow element (FE) may connect to a Flow transmitter (FT), not to a converter (FY). A converter is also referred to as a transducer; however, "transducer" is a completely general term, and its use specifically for signal conversion is not recommended. An I to P (current to pneumatic) converter is a converter we often come across in P&ID drawings.


Common Process Equipment Symbols Used in Developing Process Flow Diagrams (PFD) and P&IDs II

Custom Search


In continuation of my piece on process equipment symbols used in developing process flow diagrams and P&IDs, below is an additional list of common symbols used. You may also consult the following books for further reading:


Common Process Equipment Symbols Used in Developing Process Flow Diagrams (PFD) and P&IDs I

Custom Search


Having understood the importance of a process flow diagram(PFD) from: What is a Process Flow Diagram (PFD)?: The Basics, here is a comprehensive list of the common symbols of process equipment used in preparing PFDs and P&IDs. I have dealt with some of these symbols listed here before in Common P&ID Symbols Used in Developing Instrumentation Diagrams but here again is a comprehensive list of basic and specialized symbols that you will find useful.

After reading this post, to gain more proficiency in understanding P&IDs, Process equipment symbols and Piping System in Process Plants, please consult the following books for further reading:


Basics of Process Flow Diagrams (PFDs)

Custom Search

A PFD is a schematic representation of the sequence of all relevant operations occurring during a process and includes information considered desirable for analysis.
The Purpose of a PFD:
Process Flow Diagrams are required for the following reasons:

Plant Design Basis:
A PFD shows the plant design basis indicating feedstock, product and main streams flow rates and operating conditions.

Scope of Process:
A PFD serves to identify the scope of the process.

Equipment Configuration:
A PFD shows graphically the arrangement of major equipment, process lines and main control loops.


Required Utilities:
A PFD shows utilities which are used continuously in the process


Piping and Instrumentation Diagrams Tutorials III: Flow and Level Control

Custom Search

In continuation of my series on piping and instrumentation diagram tutorials, we shall continue with the development of P&IDs when given some information about a process or control system. Let us take a look at the tutorial question below:

Tutorial Question:
It is desirable to have a small control system to control liquid flow and consequently level in an open tank. The description of the control system is as follows:

(a) A flow control valve will be used to regulate flow. This flow control will be based on flow measurement in an orifice meter

(b) We want to automatically adjust the setpoint of the flow controller with the aid of a level control loop. As level is being measured, the set point of the flow control valve is adjusted automatically. If the level goes up, the set point of the flow control valve should be lowered and vice versa

(c) The Orifice meter should have a secondary device to transmit a 4 – 20mA signal to the control room. The secondary device should be able to indicate flow rate locally at the Orifice meter.

(d) The secondary device on the Orifice meter is required to send this 4 - 20mA electronic signal to a controller in a central control room. The flow rate should be indicated on this controller

(e) The control room will send a 4 – 20mA signal from the controller to the control valve. At the control valve, we will use an I/P converter to provide pneumatic signal to control our valve. The flow control loop will have a loop number 100.

(f) The level of the tank will be measured using a transmitter, with local indication on the transmitter.

(g) We also want to send a 4 – 20mA level signal to a level controller in the control room. This controller will display the level of the tank in the control room. 

(h) The level control instrumentation in the tank will make provision for activating high and low level alarms seen in the control room whenever the level goes too high or too low

(i) The tank should have a local sight glass or gauge for indicating level locally for plant operators

(j) The level controller will also send the level signal via wire to the flow controller in the control room, where the setpoint for the flow control valve will be adjusted. The level control loop will have the loop number 101

From the information provided above, develop the piping and instrumentation diagram (P&ID) for this control system.


Instrument Abbreviations Used in Instrumentation Diagrams (P&ID)

Custom Search


Typically instrument abbreviations used in P&IDs consist of two letters: the first indicating the process variable and the second indicating the instrument/controller function. For example, the instrument abbreviation “PI” denotes a “Pressure Indicator”. Occasionally, a third letter is included in the instrument abbreviation to describe a simultaneous function or a special function. For example: the abbreviation “FRC” represents a “Flow Recorder and Controller” which describes both the recording and control functions and the abbreviation “PAL” denotes a “Pressure Alarm Low” which describes


Piping and Instrumentation Diagrams Tutorials II: Pressure Control

Custom Search

In continuation of my series on piping and instrumentation diagrams tutorials, we shall look at how to develop and construct a simple piping and instrumentation diagrams (P&ID).
Before we start, I will advise you to go through Tutorials I . If you are completely new to P&ID, I will advise that you go through my various posts on piping and instrumentation diagrams to ensure that we are on the same page when we use the information provided to develop our P&ID.


Piping and Instrumentation Diagrams:Tutorials I

Custom Search


This post will begin a series of tutorials on P&ID to help many people seeking information on the subject to understand more about piping and instrumentation diagrams. Please read on and endeavour to go through all the posts on piping and instrumentation diagrams if you have the time. You will find the links to all my posts on P&IDs at the end of this post. Happy reading.


Common P&ID symbols used in Developing Instrumentation Diagrams

Custom Search


The symbols used in piping and Instrumentation diagrams or drawings are many and varied. I have dealt with some of these symbols before but here I have given a comprehensive list of the common P&ID symbols of process equipment such as valves, flowmeters, piping line connections, and much more. Go through them and familiarize yourself with them. However they are by no means exhaustive. Getting to know these common P&ID symbols used in developing instrumentation diagrams will ensure that each time you see a P&ID, no matter how complicated you should be able to identify a symbol or two.


Piping and Instrumentation Diagrams : Piping Line Number Identification

Custom Search


P&IDs play very important roles in plant maintenance and modification in that they demonstrate the physical sequence of equipment and system as well as how they all connect. During the Design stage they provide the basis for the development of system control schemes, allowing for further safety and operational investigations like HAZOP (Hazards and Operability Study).
Piping on a piping and instrumentation diagram(P&ID) is indicated by:
  1. Usage: For example, process, drain, nitrogen, blow down, etc.
  2. Line Number: The identification number of the line on the plant.
  3. Size: Usually in inches.
  4. Piping Class: The piping specification, both material and pressure rating
  5. The insulation class


Basic Functions of Instruments in a P&ID

Custom Search

The primary functions of instruments and control components are monitoring, display, recording and control of process variables. Instrument and control symbols consist of an instrument bubble or circle with the instrument abbreviation lettered inside the bubble. The abbreviation completely describes the function of the instrument/control component.

Instruments/control elements can be grouped into different categories based on the process variable that the instrument or the control element is monitoring or controlling. The first letter in the instrument abbreviation indicates the process variable being monitored or controlled. The four common process variables are:
1)    Flow (F)
2)    Level (G)
3)    Pressure (P)
4)    Temperature (T)


Understanding P&IDs Drawings

Custom Search

In continuation of our lessons on how to read and interpret P&IDs, let us look at the piping and instrumentation diagram below:


At first this P&ID looks complicated, but on closer examination, it is actually a simple P&ID. For easier understanding the P&ID is broken into:


How to Read and Interpret Piping and Instrumentation Diagrams (P&ID)

Custom Search


Let us consider some P&IDs in order to learn how to read and interpret them.

P&ID Drawing 1:
P&ID Diagram

As shown in the P&ID, FT 501 is a field mounted flow transmitter connected via electrical signals (dotted lines) to a flow indicator and controller, FIC 501 located in the control room. Please note that a square root extraction of the input signal is applied as part of the functionality of FIC 501. This is because flow is proportional to the square root of the differential pressure being measured by the flow transmitter. To make flow proportional to differential pressure, the square root has to be extracted.


Basics of Piping and Instrumentation Diagrams (P&IDs)

Custom Search


P&ID stands for Piping and Instrumentation Diagram or Drawing. Alternatively, it could also be called Process and Instrumentation Diagram or simply P&I diagram or drawing. P&IDs are also known as Engineering Flow Diagrams or Mechanical Flow Diagrams .P&IDs are often used in the process industry to show the process flow and other installed equipment and instruments. They show the interconnection of process equipment and the instrumentation used to control the process.
Piping and Instrumentation Diagrams play a crucial role in the design and engineering of process plants and piping systems. P&IDs are schematic diagrams that contain engineering and design details of the process plants. It is a pictorial representation of:


You May Also Like: